Job and mission analytics: build the dashboards
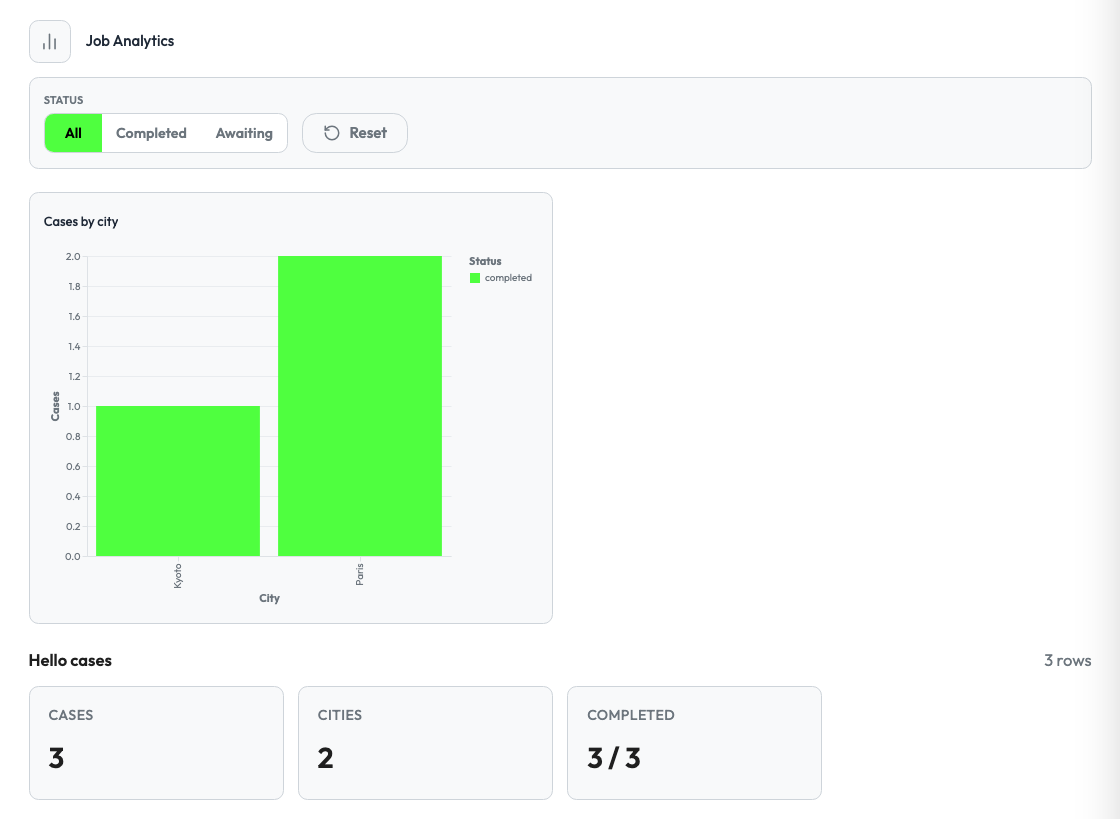
Studio can show a dashboard of your agent's data in two places. Your agent returns one Dashboard document for each, and Studio draws the KPI cards, the filters and the charts.
| Surface | Where Studio shows it | Scope of the data |
|---|---|---|
job.analytics | A Job Analytics section on each job page. For a job with a Configure screen, it is in the Operations view. | One job |
mission.analytics | The Analytics link on the mission page | All jobs of the mission |
Both surfaces use the same document and the same datasets, so one builder can serve the two.
The mission page has the same dashboard for all the jobs of the mission, with one table for each dataset:
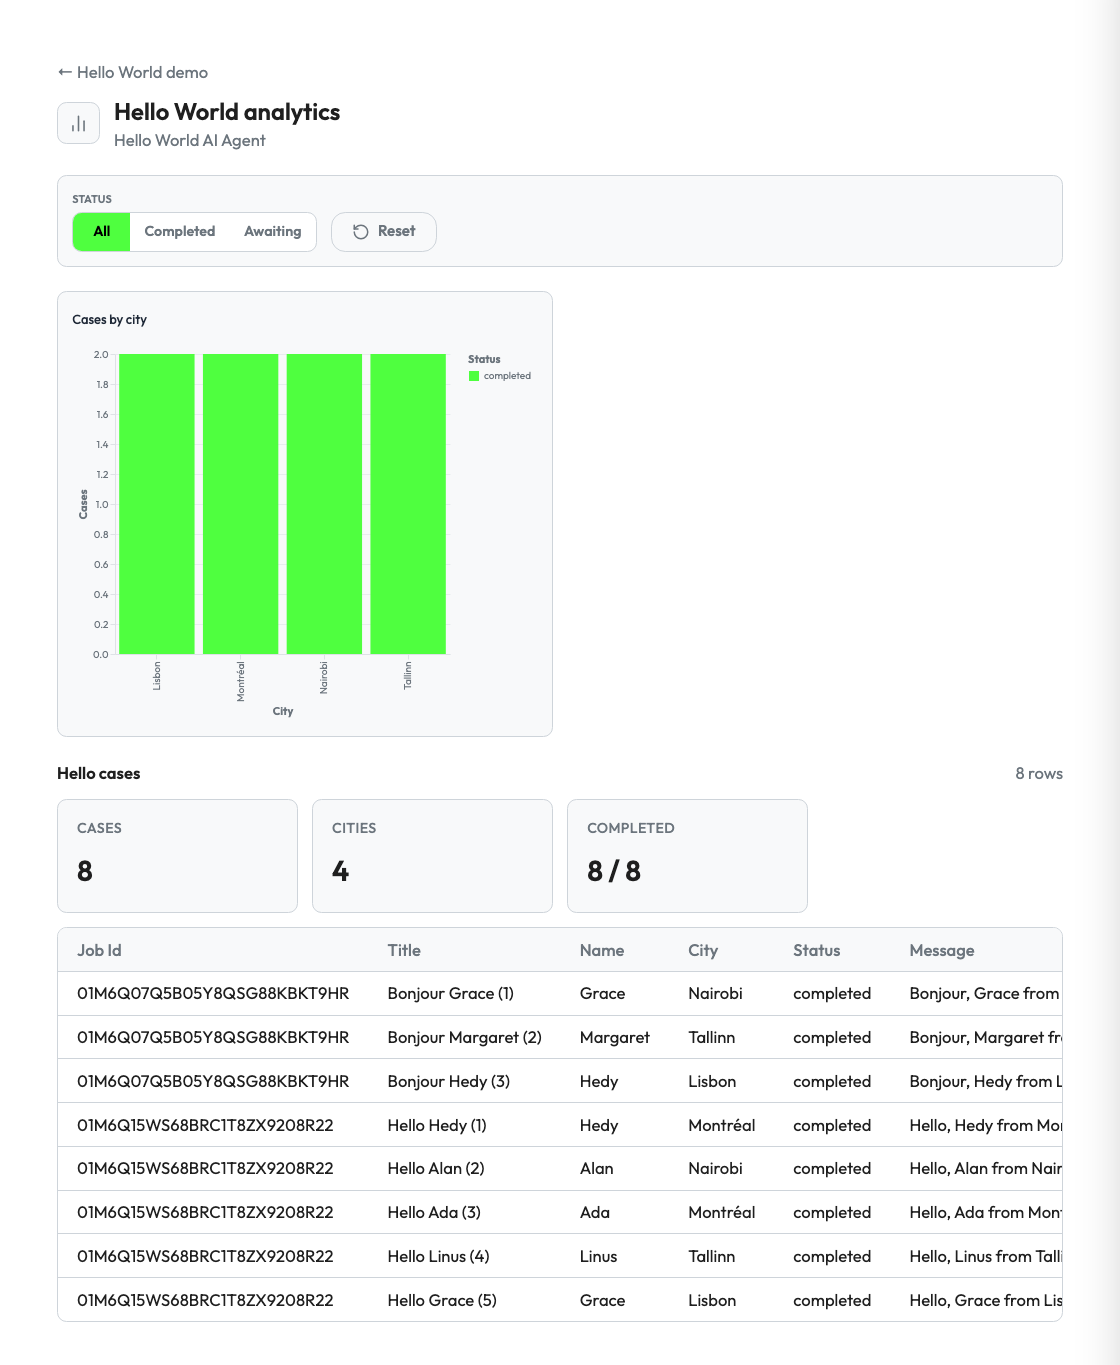
The Hello World example implements both surfaces in agent_dashboard.py.
Install the Supervaizer integration skill in your coding agent, open your agent project and ask:
Add an analytics dashboard to the jobs of this agent.
The skill asks you the design questions, then follows this guide and the Hello World example, with tests. The rest of this page is what it reads.
How it works
- The agent declares its datasets and the surface in the v2 registration.
- Studio loads the surface. For
job.analyticsthe request carries thejob_id, andinputholds the job's start fields. - The agent returns a
Dashboarddocument: datasets, controls and widgets. - For each dataset, Studio invokes the
dataset.<id>.queryaction and reads the rows. - Studio computes the metrics and draws the charts from the rows. A change of a control runs the queries again.
The agent sends data and declarative chart specifications only. It sends no HTML or JavaScript.
Step 1: declare the datasets and the surface
registration = build_v2_agent_registration(
    agent_slug="hello-world-ai-agent",
    display_name="Hello World AI Agent",
    a2ui_catalog_version="hello-world.0",
    surfaces=["job.start", "mission.analytics", "job.analytics"],
    actions=["job.start", "job.sync", "job.stop"],
    datasets=[
        {
            "id": "hello_cases",
            "label": "Hello cases",
            "display": {"columns": ["title", "city", "status"]},
        }
    ],
)
Keep the dataset at the default scope, workspace. Studio runs a dataset query from a job page only for a workspace-scoped dataset. Your query handler limits the rows to the job or the mission.
The SDK derives the action dataset.hello_cases.query with mutating=False. Register one handler for it, and one for each surface:
for surface in ("mission.analytics", "job.analytics"):
    server.register_v2_surface(surface, handle_surface, agent_slug=agent.slug)
server.register_v2_action("dataset.hello_cases.query", handle_action, agent_slug=agent.slug)
A dataset also takes auto_surface=True for a generated table surface, and a scope of workspace, mission or job.
You can also declare a dashboard in the registration. Its widgets point to a dataset:
dashboards=[
    {
        "id": "overview",
        "label": "Overview",
        "surface": "mission.analytics",  # the default
        "widgets": [
            {
                "id": "by_city",
                "title": "Cases by city",
                "data": {"mode": "ref", "datasetId": "hello_cases"},
                "visualization": {"type": "vega-lite", "spec": {"mark": "bar", "encoding": {"x": {"field": "city", "type": "nominal"}}}},
            }
        ],
    }
]
Studio shows the Job Analytics section only when job.analytics is in the registration. A new surface or action changes the grant scopes, so the workspace must accept the agent grant again.
Step 2: return the Dashboard document
{
  "type": "Dashboard",
  "id": "hello_world.job.analytics",
  "title": "Job analytics",
  "datasets": [],
  "controls": [],
  "widgets": [],
  "state": {}
}
Datasets and KPI metrics
{
  "id": "hello_cases",
  "label": "Hello cases",
  "input": { "job_ref": "01M3KEF6…", "status": "all" },
  "display": { "columns": ["title", "city", "status"] },
  "metrics": [
    { "id": "cases", "label": "Cases", "reducer": "row_count" },
    { "id": "cities", "label": "Cities", "reducer": "distinct_count", "field": "city" },
    { "id": "avg_duration", "label": "Avg duration", "reducer": "avg", "field": "duration_secs", "suffix": "s" },
    { "id": "completed", "label": "Completed", "reducer": "ratio", "numerator_field": "completed", "denominator_field": "total" }
  ]
}
idmust name a dataset of the registration.inputis sent with each query of this dataset. Use it to scope the rows, for example to the job.- Each metric becomes one KPI card. Studio computes it from the returned rows.
| Reducer | Result | Needs |
|---|---|---|
row_count | Number of rows | nothing |
sum, avg, max | Sum, average or maximum of a numeric field | field |
distinct_count | Number of different values | field |
ratio | sum(numerator) / sum(denominator), shown as 12 / 40 | numerator_field, denominator_field |
suffix adds a unit such as % or s.
Controls
Controls are the filters above the dashboard.
"controls": [
  {
    "id": "range",
    "label": "Window",
    "type": "segmented",
    "default": "14d",
    "options": [
      { "label": "7d", "value": "7d" },
      { "label": "14d", "value": "14d" },
      { "label": "All", "value": "365d" }
    ]
  },
  { "id": "date_from", "label": "From", "type": "date" }
]
The control types are segmented (a row of buttons, with options and a default) and date. Studio adds each control value to the input of every dataset query, under the control id.
Widgets
A widget is one chart. Studio renders widgets whose visualization.type is vega-lite and that carry a spec. It ignores other types.
{
  "id": "cases_by_city",
  "title": "Cases by city",
  "layout": { "w": 6, "h": 4 },
  "data": { "mode": "ref", "datasetId": "hello_cases", "input": { "status": "all" } },
  "visualization": {
    "type": "vega-lite",
    "spec": {
      "$schema": "https://vega.github.io/schema/vega-lite/v5.json",
      "mark": "bar",
      "encoding": {
        "x": { "field": "city", "type": "nominal" },
        "y": { "aggregate": "count", "type": "quantitative" }
      }
    }
  }
}
data.datasetIdnames the dataset whose rows fill the chart. Studio injects the rows as the Vega-Litedata.values.- In place of a dataset reference, a widget can hold inline rows:
"data": {"mode": "inline", "values": [...]}. layout.wandlayout.hsize the widget on a 12-column grid.xandyare optional.- Any Vega-Lite mark works: bars, lines, points, heatmaps (
rect), layered charts.
A heatmap with no data maps every cell to the middle color. Give the color scale a domain that includes zero, and add a text layer that says No available data.
Step 3: answer the dataset query
The action input is the merge of the job's start fields, the dataset input and the control values. Later values win.
def query_dataset(action_input):
    rows = load_rows(job_ref=action_input.get("job_ref"), status=action_input.get("status"))
    return {
        "status": "ok",
        "effects": [{"type": "dataset.queried", "dataset": "hello_cases", "count": len(rows), "rows": rows}],
    }
Studio reads the rows from the dataset.queried effect whose dataset equals the dataset id. Each row is a flat object. Add the numeric helper fields that your metrics need, such as completed: 1 and total: 1 for a ratio.
What differs between job and mission
job.analytics | mission.analytics | |
|---|---|---|
| Request | job_id is set; input holds the job's start fields | no job_id |
| KPI cards | yes | yes |
| Charts | yes | yes |
| Dataset tables | no | yes, one table per dataset, with display.columns |
| Usual default | the whole life of the job | a recent window |
For a job, resolve your own domain object from job_id, then put its reference in each dataset input. Check that it belongs to the workspace of the verified workspace_authorization context. A filter value is not an access boundary.
A job dashboard should cover the whole job by default. If your mission dashboard defaults to a short window, set a long one when no range is given.
Checklist
- Every dataset of the document is declared in
datasetsof the registration, with theworkspacescope. -
job.analyticsandmission.analyticsare insurfaces, each with a handler. - The query action returns a
dataset.queriedeffect withdatasetandrows. - Charts use
visualization.type: "vega-lite"with aspec. - The job dashboard scopes every dataset to the job and checks the workspace.
Troubleshooting
| Symptom | Cause |
|---|---|
| The section shows Failed to load chart data | The dataset is not workspace-scoped, or the workspace did not accept the agent grant again. |
| No Job Analytics section | job.analytics is not in the registration, or the agent was not registered again. |
| No analytics datasets declared | The document has no datasets, or their ids match no declared dataset. |
| A widget does not show | Its visualization is not vega-lite, or it has no spec. |
| KPI cards show 0 | The rows miss the metric's field, or the values are not numbers. |
| A filter changes nothing | The query handler does not read the control id from its input. |
Reference
- Job Configurator (Configure screen)
- Supervaizer v2 guide: datasets, dashboards and surfaces.
- Vega-Lite documentation